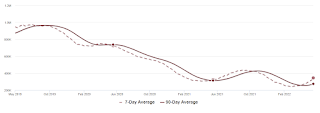
Inventory usually declines in the winter, and then increases in the spring. Inventory bottomed seasonally at the beginning of March 2022 and is now up 43% since then.
 Click on graph for larger image in graph gallery.
This inventory graph is courtesy of Altos Research.
As of May 20th, inventory was at 344 thousand (7-day average), compared to 318 thousand the prior week. Inventory was up 8.2% from the previous week.
Inventory is still very low. Compared to the same week in 2021, inventory is up 6.4% from 324 thousand, however compared to the same week in 2020, and inventory is down 52.5% from 724 thousand. Compared to 3 years ago, inventory is down 63.3% from 938 thousand.
Inventory is still very low. Compared to the same week in 2021, inventory is up 6.4% from 324 thousand, however compared to the same week in 2020, and inventory is down 52.5% from 724 thousand. Compared to 3 years ago, inventory is down 63.3% from 938 thousand.
Credits: Mortgage news daily